 The City of Fort Worth produces Exceptional Quality (EQ) Class AB biosolids, resulting from an aggressive pre-treatment program and efficient wastewater treatment processes at the Village Creek Water Reclamation Facility.
Fort Worth produces approximately 26,500 dry tons of biosolids each year from the wastewater treatment system processes, which is offered to farmers and landowners across North Texas as a valuable soil amendment. These biosolids contain important nutrients that have been shown to boost crop production.
The Village Creek Water Reclamation Facility has developed and implemented an environmental management system (EMS) for its Biosolids Program. The EMS, which is platinum certified by the National Biosolids Partnership (NBP), helps the Village Creek Water Reclamation Facility to manage and continually improve all aspects of its Biosolids Program, including solids treatment, dewatering, transporting, and beneficial land application. The Fort Worth Biosolids Program was one of the original programs to volunteer to become a NBP Demonstration Agency, becoming the seventh agency in the country and the first in Texas to receive the NBP EMS certification.
Biosolids Processing and Dewatering
Anaerobically treated biosolids are dewatered by belt filter presses, resulting in a cake product that is approximately 16 percent to 18 percent solids. This material is further stabilized with lime to eliminate pathogens. The final product is Environmental Protection Agency (EPA) Class A Exceptional Quality (EQ) Biosolids, also known as TCEQ Class AB Biosolids.
Beneficial Reuse by Land Application
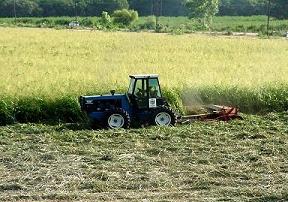
Since 1995, the City of Fort Worth’s goal has been to beneficially reuse and recycle all biosolids. The biosolids produced at Village Creek Water Reclamation Facility are processed, monitored and applied to thousands of acres of farm and pasture land in Tarrant and surrounding counties in the North Texas area. Biosolids contain nitrogen, phosphorus, organic material and other important constituents that allow it to be utilized as a high value soil amendment.
The Biosolids Program continues to grow and expand with new land application sites added each year. The program currently has a backlog list of landowners waiting for biosolids to be applied to their property. The map and the table below show the landowner participation by county in the Fort Worth Biosolids Beneficial Reuse/Recycling Program.
Fort Worth Biosolids Beneficial Reuse/Recycling Program: Land owner participation location by county
| Counties |
Land Owners |
Noticed Sites |
Noticed Acres |
% of Total Acreage |
Tons Applied
(Includes Lime)
AUG 2019-JUL 2020 |
| Bosque |
4 |
2 |
1,800 |
2.27% |
2,765 |
| Denton |
4 |
4 |
2,692 |
3.34 |
0 |
| Ellis |
9 |
22 |
1,225 |
1.55% |
1,608 |
| Hill |
19 |
50 |
17,061 |
21.52% |
9,751 |
| Hood |
6 |
10 |
10,048 |
12.67% |
0 |
| Johnson |
21 |
4 |
17,515 |
22.09 |
10,781 |
| Kaufman |
4 |
4 |
2,650 |
3.34% |
0 |
| Parker |
6 |
4 |
12,389 |
15.63% |
0 |
| Tarrant |
5 |
5 |
2,192 |
2.77 |
782 |
| Wise |
19 |
25 |
11,707 |
14.77 |
3,808 |
| Total |
95 |
130 |
79,279 |
100% |
29,495 |
The city changed biosolids contractors on April 1, 2020. The contractor from August 2019 through March 2020 was RENDA Environmental Inc. On April 1, Synagro became the new contractor. The contractor is responsible for:
- operating the dewatering facility and further processing the biosolids by belt-filter press dewatering
- stabilization by lime addition
- transportation
- land application to beneficially reuse the biosolids produced at Village Creek Water Reclamation Facility.
Oversight/Inspections
The water utility performs routine and unannounced visits and inspections to the dewatering facility and land application sites to ensure that best biosolids management practices are followed.
Monitoring and Measurement
By city contract, the contractor uses an independent certified laboratory to analyze the biosolids produced at Village Creek Water Reclamation Facility.
Samples of biosolids are taken from the process areas and analyzed for fecal coliform, pathogens, metals, PCBs, pH, percentage solids, and vector attraction reduction. Sampling frequency is established by the contract as well as by federal, state, and local regulatory reporting requirements.
Class “AB” Biosolids Monitoring — Fort Worth Biosolids Program
- Pathogen Reduction: 30 Texas Administrative Code (TAC) 312.82 (a) Alternative 4
- Fecal Coliform Density: less than 1,000 MPN (Most Probably Number)
- Enteric Virus Density: less than one plaque-forming unit per 4 gram total solids (dry weight basis)
- Viable Helminth Ova Density less than 1 per 4 grams total solids (dry weight basis)
- Vector Attraction Reduction: 30 TAC 312.83 (b) (1-8) Alternative 6
- pH of sewage sludge shall be raised to 12 or higher by alkali addition and, without the addition of more alkali, shall remain at 12 or higher for two hours and then remain at a pH of 11.5 or higher for an additional 22 hours
| Monitored Item |
Frequency |
| Fecal Coliform |
Two times per month |
| Pathogens |
Two times per month |
| Metals |
Monthly |
| PCBs |
Monthly |
| Toxicity Characteristic Leaching Procedure (TCLP) |
Two times per year |
| pH (Vector Attraction Reduction) |
Operation Process-Daily; Regulatory Compliance-Weekly |
| Percent Solids |
Daily |
Ten metals and polychlorinated biphenyls (PCBs) are analyzed monthly. In program year 2019-2020, all metal concentrations were significantly below Table 1 ceiling concentration limits and Table 3 pollutant concentrations, as required by the U.S. EPA Part 503 federal regulations for the use or disposal of sewage sludge. The metal concentrations are listed below.
Average Monthly Metal & PCB* Concentrations
(reported in milligrams/kilograms [mg/kg] dry weight basis)
0.00
| Year 2019-2020 |
Arsenic (As) mg/kg |
Cadmium (Cd) mg/kg |
Chromium (Cr) mg/kg |
Copper (Cu)
mg/kg |
Lead (Pb)mg/kg |
Mercury (Hg)mg/kg |
Molybdenum (Mo)
mg/kg |
Nickel (Ni)
mg/kg |
Selenium (Se)
mg/kg |
Zinc (Zn)
mg/kg |
PCB
mg/kg |
| NPDES** Permit Limits (Table 1) |
75 |
85 |
3000 |
4300 |
840 |
57 |
75 |
420 |
100 |
7500 |
n/a |
| NPDES** Permit Limits (Table 3) |
41 |
39 |
1200 |
1500 |
300 |
17 |
*** |
420 |
36 |
2800 |
n/a |
| August |
7.10 |
0.00 |
38.7 |
439 |
19.40 |
0.75 |
24.70 |
36.20 |
4.90 |
594 |
0.00 |
| September |
10.50 |
0.00 |
30.3 |
443 |
15.7 |
0.27 |
0 |
35.10 |
7.3 |
531 |
0.00 |
| October |
12.80 |
0.00 |
49.5 |
426 |
17.40 |
0.39 |
29.10 |
36.60 |
9.10 |
517 |
0.00 |
| November |
15.60 |
0.00 |
62.60 |
343 |
15.90 |
0.23 |
0.00 |
40.70 |
0.00 |
447 |
0.00 |
| December |
13.70 |
0.00 |
55.50 |
445 |
21.10 |
0.50 |
0.00 |
32.4 |
0.00 |
429 |
0.00 |
| January |
7.00 |
0.00 |
36.30 |
367 |
14.70 |
0.32 |
0.00 |
24.4 |
0.00 |
425 |
0.00 |
| February |
5.70 |
0.00 |
48.1 |
392 |
17.00 |
0.24 |
0.00 |
31.70 |
5.70 |
632 |
0.00 |
| March |
6.50 |
0.00 |
46.1 |
351 |
15.00 |
0.25 |
0.00 |
26.30 |
7.30 |
541 |
0.00 |
| April |
7.50 |
0.00 |
49.4 |
355 |
19.00 |
0.32 |
17.70 |
29.60 |
4.67 |
571 |
0.00 |
| May |
6.10 |
0.64 |
50.00 |
413 |
17.90 |
0.22 |
23.20 |
25.80 |
5.10 |
596 |
0.00 |
| June |
8.40 |
0.74 |
45.90 |
452 |
17.70 |
0.18 |
26.80 |
36.40 |
4.40 |
539 |
0.00 |
| July |
1.10 |
0.00 |
39.40 |
399 |
16.20 |
0.23 |
27.00 |
27.50 |
6.51 |
534 |
0.00 |
| Yearly Average Metals Concentration |
9.93 |
0.69 |
45.98 |
402.08 |
17.25 |
0.32 |
24.75 |
31.89 |
6.11 |
538 |
ND |
| Highest Monthly Concentration |
15.60 |
0.74 |
62.60 |
452.00 |
21.10 |
0.75 |
29.10 |
40.70 |
9.10 |
632 |
ND |
* Polychlorinated biphenyls
** National Pollutant Discharge Elimination System
***No limit established by federal regulations
Pathogen Requirement Achieved: EPA Class A/TCEQ Class AB
Pathogen Reduction Alternative Used: 4
Vector Attraction Reduction Alternative Used: Alternative 1
The biosolids program's Environmental Management System documents and annual reports are available for review and download.