Annual Water Quality Report

The Annual Water Quality Report provides factual information about your drinking water including sources, water quality and treatment processes andskyline image of Fort Worth from banks of the Trinity River summarizes the data collected in 2022.

For Fort Worth Water, this document is more than just a requirement. It is a way of informing you about the high quality drinking water we enjoy. Providing safe, reliable and affordable drinking water to our customers is a top priority. 

Every day, the utility invests in training, education and development to shape our employees into some of the best in the industry with you in mind. Employees are proud of their accomplishments and are dedicated to providing you with the best tap water. Over the years, staff has received countless awards for their hard work and efforts, and it all comes back to providing the highest standards of drinking water. 

There is a lot of information in this report. If you have any questions about the information provided, have other questions about the utility, or would like to request a hard copy of the report, contact us at 817-392-4477 or wpe@FortWorthTexas.gov.

View and download a PDF printable version of the report using one of the following links.

2022 Annual Water Quality Report(PDF, 16MB)

Reporte de al Calidad del Agua(PDF, 17MB)

Message from the water director

Fort Worth Water is dedicated to delivering our customers safe, reliable and affordable drinking water.

In this annual Water Quality Report, you will read how Fort Worth places water quality as its highest priority. Our staff is a dedicated group of professionals focusing on customer health and making sure you have excellent water at your tap when you need a drink, take a bath or want to cook a meal. 

Every step, from treatment, through storage and distribution, the water to your home or business has been deeply cared for. Our employees are licensed to treat water, operate the distribution systems, take water samples and repair pipes. 

In this issue, you will learn where our water comes from and how it gets delivered to our customers. The report also includes regulatory testing results and information about how the utility is working to reduce water loss and about changes in the federal rules related to lead and copper pipes. 

Following two harsh winter storms in 2021 and 2022, renewed focus on resiliency and reliability to ensure Fort Worth Water continues to deliver clean water to our customers, particularly during winter events became a priority.

Fort Worth has neighborhoods with cast iron mains that are  100 years old. While remarkable they’ve been in service that long, many of those pipes broke or leaked during the harsh winter events of 2021 and 2022. Since then, we have accelerated replacing cast iron pipes. 

Water utilities constantly address changing regulatory, economic and legislative environments. Rules and regulations can be complex, but when you read this report, you will gain a better understanding of the work that went into providing you with high quality water.

There is a lot of information in this report. We follow federal rules in presenting it to you. 

We want the communities we serve to be knowledgeable regarding their water supply and assured that their drinking water is of the highest quality.

If you have any questions regarding this report or water quality in general, please contact us at 817-392-4477 or wpe@FortWorthTexas.gov.

Chris Harder, P.E., Water Director

Important information

People with compromised immune systems may be more vulnerable

You may be more vulnerable than the general population to certain microbial contaminants, such as Cryptosporidium, in drinking water. Infants, some elderly, or immunocompromised persons such as those undergoing chemotherapy for cancer; those who have undergone organ transplants; those who are undergoing treatment with steroids; and people with HIV/AIDS or other immune system disorders can be particularly at risk from infections. You should seek advice about drinking water from your physician or health care provider. Additional guidelines on appropriate means to lessen the risk of infection by Cryptosporidium are available from the Safe Drinking Water Hotline at (800) 426-4791.


Did you know?

Fort Worth carries the designation of Superior Public Water System, having met stringent requirements of the Texas Commission on Environmental Quality.

Having the superior rating reflects the commitment and dedication of the Fort Worth Water utility staff to exceed minimum acceptable standards.

In addition to water quality, the high designation points to the overall water system operations, for treatment, how many licensed operators it has, storage capacity and facility conditions, among other things.

To receive or maintain recognition as a superior water system, TCEQ inspects and evaluates the utility as to physical facilities, appearance and operation.


Who is Who & Who Does What?

Fort Worth and the Tarrant Regional Water District provide much of North Texas with safe and reliable water, and raw water, respectively. Through conservation efforts, each play a role in making sure we have enough water for the future. Both are committed to conserving our natural resources.

Fort Worth Water

FWW provides drinking water, wastewater and reclaimed water services to its roughly 280,000 accounts and one or more of those services to 38 wholesale customers. In Fiscal Year 2021, the city purchased 76.3 billion gallons of raw water from TRWD to treat for drinking and other uses. 

Tarrant Regional Water District

TRWD provides raw water to 70 customers, including Fort Worth. The district owns Bridgeport, Cedar Creek, Eagle Mountain lakes, and Richland-Chambers Reservoir. The district owns 250 miles of pipeline that transports raw water from the lakes east of Dallas to Tarrant County.


Want to know more about water?

Fort Worth Water has employees who volunteer to talk at Career Day presentations as well as work events for the utility, city and community. The H2O Heroes talk about a typical work day, education training requirements and what students need to focus on in studies to have a career in the water sector.

If you are interested in a school or community group presentation, email us at wpe@FortWorthTexas.gov.


Check Out Our Award-Winning Podcast, H2OMG!

Just search for "H2OMG" on your favorite podcast app or check us out at www.theh2omg.podbean.com.

Source waters and treatment

Municipal water sources can include surface, ground, and/or recycled water. In Fort Worth, the utility uses 100% surface water from area lakes to provide drinking water. 

This section identifies the water sources used to provide you with quality drinking water, details on the water treatment process used by the utility, and information about the staff committed to keeping our water supply safe and reliable.


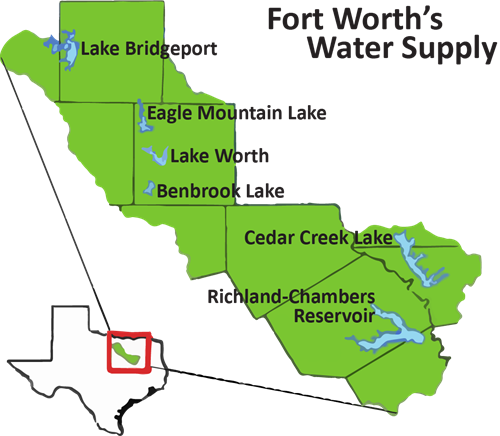
Where does my water come from?

Supplying water to the nation’s 13th largest city is no easy feat and the challenges going forward as Fort Worth continues to grow will become even greater as demand for water increases. Sure, we see water in many places, such as the lakes, rivers and streams that dot the Texas landscape, and think our water supply is plentiful. That’s not the case. Water is a precious commodity and it takes so much more to get clean, quality water to your kitchen faucet than just pumping it from those sources.

Currently, Fort Worth’s water supply comes from Lake Worth, Lake Bridgeport, Eagle Mountain Lake, Benbrook Lake, Richland Chambers Reservoir, Cedar Creek Reservoir and the Clear Fork of the Trinity River. Fort Worth owns Lake Worth, and Benbrook Lake is the responsibility of the U.S. Army Corps of Engineers. The Tarrant Regional Water District (TRWD) owns and operates the four remaining lakes.

map showing Fort Worth's water supply sources

Microorganism testing shows low detections in raw water

Tarrant Regional Water District monitors the raw water at all intake sites for Cryptosporidium, Giardia Lamblia and viruses. The source is human and animal fecal waste in the watershed. 

The 2023 sampling showed occasional low level detections of Cryptosporidium, Giardia lamblia and viruses in some but not all of the water supply sources. These are either deactivated or removed through disinfection and/or filtration. 


TCEQ assess raw water supplies for susceptibility

The Texas Commission on Environmental Quality completed an assessment of Fort Worth’s source waters. TCEQ classified the risk to our source waters as high for most contaminants.

The sampling requirements for Fort Worth’s water system is based on this susceptibility and previous sample data. Any detections of these contaminants are found in this water quality report. 

For more information on source water assessments and protection efforts at our system, contact Stacy Walters at 817-392-8203.

Further details about the source-water assessments are available in the Texas Commission on Environmental Quality’s Drinking Water Watch database at bit.ly/TCEQDWW2021.


Rainfall and lake levels

Locally, the average annual rainfall totals about 37 inches compared to just over 40 inches a year south of Dallas where Richland Chambers and Cedar Creek reservoirs are located. 

TRWD constructed Cedar Creek Lake in the 1960s, and in 1972, the Rolling Hills plant began treating drinking water. In 2021, the city bought 76.3 billion gallons of raw water from TRWD.

Fort Worth can treat about 500 million gallons of drinking water a day. The utility provides water to more than 1.3 million people in Fort Worth and surrounding communities. 


Potential Raw Water Impurities

Contaminants found in drinking water may cause taste, color, or odor problems. These types of problems are not necessarily causes for health concerns. For more information on taste, odor, or color of drinking water, please contact customer service at 817-392-4477.

Drinking water, including bottled water, may reasonably be expected to contain at least small amounts of some contaminants. The presence of contaminants does not necessarily indicate that water poses a health risk. More information about contaminants and potential health effects can be obtained by calling the EPA’s Safe Drinking Water Hotline at 800-426-4791.

As water travels over the surface of the land or through the ground, it dissolves naturally occurring minerals and, in some cases, radioactive material, and can pick up substances resulting from the presence of animals or from human activity.

Microbial contaminants, such as viruses and bacteria, which may come from sewage treatment plants, septic systems, agricultural livestock operations, and wildlife.

Inorganic contaminants, such as salts and metals, which can be naturally-occurring or result from urban stormwater runoff, industrial or domestic wastewater discharges, oil and gas production, mining, or farming.

Pesticides and herbicides, which may come from a variety of sources such as agriculture, urban storm water runoff and residential uses.

Organic chemical contaminants, including synthetic and volatile organic chemicals, which are by-products of industrial processes and petroleum production, and can also come from gas stations, urban storm water runoff, and septic systems.

Radioactive contaminants, which can be naturally-occurring or be the result of oil and gas production and mining activities.

In order to ensure that tap water is safe to drink, the EPA prescribes regulations that limit the amount of certain contaminants in water provided by public water systems. Food and Drug Administration regulations establish limits for contaminants in bottled water that must provide the same protection for public health.


Conservation is a Water Source

Water is a limited resource in the West and Fort Worth is no exception. While building new lakes seems like a simple solution to increasing water supply, the reality is lake construction is a massive financial and planning venture. The construction of any new lake would need to take place east of Fort Worth, where rainfall is more plentiful. Nevertheless, this would still increase the infrastructure needed and future water costs to pump the water back West. 

A painless solution is to save the water we have through conservation. According to the current State Water Plan, water conservation strategies will supply approximately 25% of our future water. Fort Worth Water added a conservation section in 2008 and has since worked hard to extend resources.

Fort Worth has a series of “Smart” programs that advance water conservation. These are available to all Fort Worth water account holders. Conservation also supports the city’s maximum twice a week watering schedule adopted by City Council in 2014. Fort Worth’s watering schedule has been instrumental in reducing local water needs. For more information, visit savefortworthwater.org.

Water distribution and delivery system

The water distribution system is the network of pipes, storage facilities, pumps and other equipment that carry potable water from a treatment plant to customers’ homes and businesses.

In addition to providing statistical facts about the Fort Worth Water utility, this section’s goal is to explain many utility actions some people might not understand—such as flushing fire hydrants.

This section also serves to convey information about the quality of our water.


 100-Year-Old Infrastructure Facelift

Fort Worth Water wants to ensure all residents have access to safe, clean, affordable drinking water and wastewater services. 

Unlike other areas in the nation, Fort Worth has an adequate infrastructure that allows it to provide reliable service. However, after 100 years of service, it is time to replace many of the cast iron water mains in Fort Worth’s oldest neighborhoods. Doing so ensures dependable service, as well as reduce water loss which will help to decrease costs for the utility and customers. 

The utility has experienced a large number of water main breaks in our distribution system over the past two winters due to the extreme cold. To handle the volume, field operations crews and private contractors repaired the breaks.

Fort Worth Water's distribution system consists primarily of concrete, PVC, ductile iron, steel, cast iron and galvanized pipe materials.

The majority of the breaks occurred with cast iron pipe. These water mains were installed between 1920 and 1950. These mains are now the weakest in the system and are susceptible to rust, resulting in breaks and the loss of water during extreme cold weather.

In fiscal year 2022, 87 percent of the main breaks were cast iron pipes. Fort Worth has about 815 miles of cast iron mains in its system.

To address frequent main breaks, utility management committed to replacing a minimum of 20 miles of cast iron pipe every year. Currently, there are 55 miles of cast iron mains at various stages of design for replacement in fiscal year 2023 and beyond.

Cast iron pipes are being replaced citywide, but they tend to be located in older neighborhoods. Replacing them with materials such as PVC should result in fewer water main breaks, water leaks, and less water loss, which will result in lower operating costs and fewer service impacts to our customers.   

In conjunction with water main replacements, deteriorated sanitary sewer mains located within the same streets will also be designed and replaced. These sewer mains are part of the Sanitary Sewer Overflow Initiative (SSOI) with the Texas Commission on Environmental Quality.

According to the terms of the SSOI program, Fort Worth Water committed to replacing and/or rehabilitating 10 miles of sanitary sewer mains a year. 


Did you know?

Fort Worth carries the designation of Superior Public Water System, having met stringent requirements of the Texas Commission on Environmental Quality.

Having the superior rating reflects the commitment and dedication of the Fort Worth Water utility staff to exceed minimum acceptable standards.

In addition to water quality, the high designation points to the overall water system operations, for treatment, how many licensed operators it has, storage capacity and facility conditions, among other things.

To receive or maintain recognition as a superior water system, TCEQ inspects and evaluates the utility as to physical facilities, appearance and operation.

At home (including lead and copper test results)

Water quality is Fort Worth’s highest priority. Staff is dedicated to ensuring the water you drink is of the highest quality, from treatment, through storage and distribution, to your home or place of business.

The private plumbing in homes and businesses can impact water quality.

This section includes information that directly affects the homes and business of customers.


Where your service line ends & the utility's begins

 The Environmental Protection Agency defines the service line as the pipe that connects a home or business to the water main in the street.  It extends from the water main to the building inlet. There is a shared ownership.

In Fort Worth, the utility owns the portion from the main to the meter, the meter and meter box.

The property owner is responsible for the pipeline exiting from the meter to the home or business plus all plumbing and fixtures inside the home or business.

Image showing the water utility owns the service line from the main to the meter and the meter while the property owner owns the portion from the meter to the home or building.

Lead & Copper Testing

If present, elevated levels of lead can cause serious health problems, especially for pregnant women and young children. 

Lead in drinking water is primarily from materials and components associated with service lines and home plumbing. Fort Worth is responsible for providing high quality drinking water, but cannot control the variety of materials used in plumbing components. 

When your water has been sitting for several hours, you can minimize the potential for lead exposure by flushing your tap for 30 seconds to two minutes before using water for drinking or cooking. 

If you are concerned about lead in your water, you may want to have your water tested. Information on lead in drinking water, testing methods, and steps you can take to minimize exposure is available from the Safe Drinking Water Hotline or at epa.gov/safewater/lead. 


Lead and Copper Test Results

Lead and copper are regulated by a treatment technique that requires systems to control the corrosiveness of their water.

 Contaminant  Measure  Violation?  Action Level 90th percentile  Public Health Goal Common sources of substance 

 Lead

 ppb

 No

 15

3.3

 0

 Corrosion of household plumbing systems; erosion of natural deposits

 Copper

 ppm

 No

 1.3

0.4

 0

90th percentile value:

90 percent of the samples were at or below this value. EPA considers the 90th percentile value the same as an “average” value for other contaminants. Lead and copper are regulated by a treatment technique that requires systems to control the corrosiveness of their water. If more than 10 percent of tap water samples exceed the action level, water systems must take additional steps.

Action Level:

The concentration of a contaminant which, if exceeded, triggers treatment or other requirements that a water system must follow.


Lead in Drinking Water: The Rules Are Changing

Locating and eliminating city-owned lead service lines has been a priority for Fort Worth Water since 2016. 

Starting on the inventory seven years ago places Fort Worth in an excellent position to meet new federal regulations related to lead. All public water systems must comply with the new rules starting Oct. 16, 2024.

All water utilities must create an inventory for every service connection that shows the pipe material for both the utility and customer owned portions of the service line. The inventory is the basis for meeting all other aspects of the rule. 

Some of the key items that Fort Worth Water customers need to know are listed below.

  • An inventory of service line materials on both sides of the meter will be available online.
  • Lead and galvanized pipes downstream of lead pipes in the system will require replacement.
  • The process for customers collecting compliance samples changes from just one liter to five liters.  
  • Customers with service lines classified as lead, galvanized requiring replacement, or unknown, will receive notices annually.
  • Customers with service lines classified as lead, galvanized requiring replacement, or unknown will receive more communication when certain other activities occur, such as construction or service disruptions. 
  • The utility is to test all elementary schools and registered daycares for lead (20% a year for five years), and provide the school, and local and state health departments, with the results. This includes public, private, charter and parochial schools.

Fort Worth Water is collaborating with other city departments and outside agencies to prepare and meet the new rule requirements. 


Corrosion Control

Corrosion control reduces the risk of lead breaking off or dissolving into drinking water. To meet the requirements of the Lead and Copper Rule, Fort Worth achieves corrosion control through pH adjustment.

What is in your water (data tables)

The Texas Commission on Environmental Quality and the Environmental Protection Agency requires most public water systems to provide this report to their customers every year. The utility must include certain information to keep customers well informed about the water they receive at home and place of work.

In this section, you will find information about chemical and bacteriological contaminants, compliance with drinking water rules, and educational health information. In addition, it provides answers to common public questions.

  • Fort Worth's drinking water is tested for all compounds on EPA's primary contaminant list.
  • Only contaminants detected are shown in the following tables. 
  • The frequency of testing varies for the contaminants. For contaminants that are regularly not found or are found at very low levels, EPA allows for monitoring only every three, six or nine years.


Abbreviations used in the data tables

The tables that list the constituents found in your drinking water use several abbreviations. Here is a list of what those abbreviations mean.

MCL: Maximum Contaminant Level – the highest level of a contaminant that is ­allowed in drinking water. MCLs are set as close to the MCLGs as feasible using the best available treatment technology.

MCLG: Maximum Contaminant Level Goal – the level of a contaminant in ­drinking water below which there is no known or expected risk to health. MCLGs allow for a margin of safety. 

MRDL: Maximum Residual Disinfectant Level – the highest level of a disinfectant allowed in drinking water. There is convincing evidence that addition of a disinfectant is necessary for control of microbial contaminants.

MRDLG: Maximum Residual ­Disinfectant Level Goal – the level of a drinking water disinfectant below which there is no known or expected risk to health. MRDLGs do not reflect the benefits of the use of disinfectants to control microbial contaminants.

N/A - not applicable/does not apply

NTU – Nephelometric Turbidity Unit; a measure of water turbidity or ­clarity

µmhos/cm – Micromhos per centimeter unit of measurement for electrical conductivity

pCi/L – Picocuries per liter; a measure of radioactivity 

ppm – Parts per million or milligrams per liter (mg/L) 

ppb – Parts per billion or micrograms per liter (µg/L)

ppt - Parts per trillion or nanograms per liter (ng/L)

TT: Treatment Technique – a required process intended to reduce the level of a contaminant in drinking water


Microorganisms

Turbidity is a measure of the cloudiness of water. It is monitored because it is a good indicator of the effectiveness of the filtration system.

Compound Measure Year Violation? MCL or TT Your water Public Health Goal Common sources of substance

Turbidity

 NTU

 2022

 No

TT=1

 0.7

 N/A

Soil runoff

 TT=lowest monthly % of samples ≤ 0.3 NTU

 99.9%

Total Coliforms (­including fecal coliform & E. coli)

 N/A

2022

No

TT = 5% of monthly samples are positive

2.4%

0

Coliforms are naturally present in the environment as well as feces; fecal coliforms and E. coli only come from human and animal fecal waste.


Organic

Compound Measure Year Violation? MCL Your water Range Public Health Goal Common sources of substance

Atrazine

ppb

2022

No

3

0.1

0 to 0.1

3

Runoff from herbicide used on row crops


Inorganic

Compound Measure Year Violation? MCL Your water Range Public Health Goal Common sources of substance

Arsenic

ppb

2022

No

10

1.7

0 to 1.7

0

Erosion of natural deposits; runoff from orchards; runoff from glass and electronics production wastes

Barium

ppm

2022

No

2

0.08

0.04 to 0.08

2

Discharge of drilling wastes; discharge from metal refineries; erosion of natural deposits

Chromium

ppb

2022

No

100

2.8

0 to 2.8

100

Erosion of natural deposits; discharge from steel and pulp mills

Cyanide

ppb

2022

No

200

51

0 to 51

200

Discharge from plastic and fertilizer factories; discharge from steel and metal factories

Fluoride

ppb

2022

No

4

0.64

0.18 to 0.64

4

Erosion of natural ­deposits; water additive which promotes strong teeth; discharge from fertilizer and aluminum factories

Nitrate

ppm

2022

No

10

0.57

0.13 to 0.57

10

Runoff from fertilizer use; leaching from septic tanks, sewage; ­erosion of natural deposits


Radionuclides

Compound Measure Year Violation? MCL Your water  Range Public Health Goal Common sources of substance

 Beta/photon emitters

 pCi/L

2021

No

50

7

7 to 7

0

Decay of natural and man-made deposits

 Uranium

 ppb

2021 

 No

30

1.1

1.1 to 1.1

0

Erosion of natural deposits


Disinfectants

Compound Measure Year Violation? MRDL Your water Range Public Health Goal Common sources of substance

Chloramines

 ppm

 2022

 No

 4

 3.4

1.4 to 4.3

 4

 Water additive used to control microbes


Total Organic Carbon

This is a measurement of the raw water. It is used to determine disinfection by-product precursors. Fort Worth was in compliance with all monitoring and treatment technique requirements for disinfection by-product precursors. A removal ratio of 1 in Specific Ultra Violet Absorbance calculations is considered passing.

Compound MCL Year Violation? High Low Average Public Health Goal Common sources of substance

Total Organic Carbon

TT=% removal

2022

No

1

1

1

N/A

Water additive used to control microbes


Disinfection byproducts

Compound Measure Year Violation? MCL Your water Range Public Health Goal Common sources of substance

Bromate

ppb

2022

No

10

5.81

0 to 137

0

By-product of drinking water disinfection

Haloacetic Acids

ppb

2022

No

60

7.98

2.2 to 7.4

N/A

By-product of drinking water disinfection

Total Trihalomethanes

ppb

2022

No

80

13.9

0 to 17.3

N/A

By-product of drinking water disinfection


Unregulated disinfection byproducts

The following items are all disinfection by-products that are not regulated individually, but are regulated as two groups — Total Trihalomethanes and Haloacetic Acids. The above chart for Disinfection Byproducts lists the regulated group levels.

Compound

Measure

Year

Public Health Goal

Average

Range

Common sources of substance

Bromoform

ppb

2022

0

0.62

0 to 3.24

By-products of drinking water disinfection; regulated as a group called Total ­Trihalomethanes

Bromodichloromethane

ppb

2022

0

2.93

3.41 to 5.43

Chloroform

ppb

2022

70

2.45

3.74 to 5.71

Dibromochloromethane

ppb

2022

60

2.41

1.96 to 5.90

Dibromoacetic Acid

ppb

2022

 N/A

1.24

1.40 to 2.90

By-products of drinking water disinfection; regulated as a group called Haloacetic Acids

Dichloroacetic Acid

ppb

2022

0

3.47

4.50 to 5.60

Monobromoacetic Acid

ppb

2022

N/A

0

0 to 0

Monochloroacetic Acid

 ppb

2022

70

0.02

0 to 1

Trichloroacetic Acid

 ppb

2022

20

0

0 to 0


Secondary constituents

Secondary contaminants do not relate to public health but rather to the aesthetic ­effects, such as taste, odor and color. These items are often important to industries.

Compound
Measure
Your water

Bicarbonate

ppm

87.6 to 144

Calcium

ppm

33.6 to 51.9

Chloride

ppm

20.9 to 47.0

Conductivity

µmhos/cm

310 to 475

pH

units

8.1 to 8 .5

Magnesium

ppm

3.95 to 10.0

Sodium

ppm

25.2 to 35.0

Sulfate

ppm

26.0 to 41.6

Total Alkalinity

ppm

90.4 to 144

Total Dissolved Solids

ppm

161 to 278

Total Hardness

ppm

100 to 171

Total Hardness in grains

grains per gallon

6 to 10


EPA Collects Data to Decide Future Regulations

Water utilities in the United States monitor for more than 100 contaminants and must meet numerous regulations for water safety and quality. 

But should other contaminants be regulated? The 1996 Safe Drinking Water Act amendments require that once every five years EPA issue a new list of no more than 30 unregulated contaminants to be monitored by public water systems.

Monitoring for these contaminants helps EPA decide whether the contaminants should have a standard set to protect public health.

UCMR testing provides scientifically valid data on the occurrence of these contaminants in drinking water. Health research is necessary to know whether these contaminants pose a health risk.

For the Fifth Unregulated Contaminant Rule, (UCMR 5), public water systems must sample 30 contaminants for four consecutive quarters from 2023 to 2025. 

Fort Worth’s sampling occurs from January 2023 through January 2024. 

Fort Worth Water is posting the sampling results on its website at www.fortworthtexas.gov/departments/water/drinking-water/ucmr

Additional Information: www.epa.gov/dwucmr


What is being tested in UCMR 5?

In UCMR 5, EPA selected 29 per- and polyfluoralkyl substances (PFAS) and one metal/pharmaceutical — lithium. 

PFAS are a group of synthetic chemicals used in a wide range of consumer products and industrial applications. 

These include non-stick cookware, water-repellent clothing, stain-resistant fabrics and carpets, cosmetics, firefighting foams, electroplating, and products that resist grease, water, and oil.

PFAS are found in the blood of people and animals and in water, air, fish, and soil at locations across the United States and the world. 

Lithium is a naturally occurring metal that may concentrate in brine waters. Lithium salts are used as pharmaceuticals, in electrochemical cells, batteries and organic syntheses.

Contact us and follow us

Water Customer Service 

817-392-4477 

7 a.m.-7 p.m. | Monday-Friday

24-Hour Emergencies select Option 1


Water Bill Payment Portal 

www.FortWorthTexas.gov/paywaterbill


Water Administration

Fort Worth City Hall

200 Texas Street, 2nd floor

Fort Worth, TX 76102

Water Leadership Team

www.FortWorthTexas.gov/water

www.SaveFortWorthWater.org 


City Council

The Water Department is part of the City of Fort Worth, Texas. Council meetings are open to the public and take place Tuesdays, at City Hall. See the City Calendar for meeting dates and times.

www.FortWorthTexas.gov/calendar/council 


Follow us on social media

Facebook: @FortWorthWater | @FortWorthAgua

Twitter: @FWWater | @FWAgua

Instagram: @SaveFWwater

LinkedIn: Fort Worth Water

YouTube: youtube.com/fortworthwater

Other resources

Environmental Protection Agency 

www.epa.gov 

Texas Commission on Environmental Quality

www.tceq.texas.gov 

Texas Water Development Board

www.twdb.texas.gov 

American Water Works Association

www.awwa.org 

Drink Tap

www.drinktap.org


Water Quality Reports from previous years

The reports below are in PDF format